Hierarchial Clustering: Intuition and Types
Today I faced a bit of a problem on my IBM UNSW data science problem, I have the feature “project_description” which includes a range of inputs ranging from “FACADE/ROOFS” to “FY16 RESO A IP SURVEILLANCE CAMERA INSTALLATION”. I recently used a automated labelling method for another feature, but this seem too big of a task for this feature. After researching for a bit I’v found another possible solution “Clustering”! So today I want to share a little overview about clustering, all information is from “Data and Knowledge Modeling and Analysis” via University of waterloo and University of North Caroline at Chapel Hill Chpt.7 Clustering techniques.
What is clustering?
It is form of unsupervised learning, which means there is nothing we a trying to predict or classify, rather we are trying to put samples together based on similarity, therefore our data is unlabeled. What does this really mean? In supervised learning our client our label feature “we are trying to predict project failure”, but in unlabeled data they still give use an objective, but there is not specific feature why are trying to predict or classify using.
So in a sense we are trying to find inherent structure of the date, even though it may not entirely exist!
Definition of clustering : group of instances based on similarity and dissimilarity.
Regularly, clustering is used for market segmentation, that is given a set of data, form groups on with inherent characteristic (features) so that was can maximize return on advertisement.
Types of clustering algorithms
There are four main types of clustering approaches:
- Hierarchical Approach
- Partitioning Approach
- Density based approach
- others - NN, Kernal, Affinity Prop
Today I want to give intuition and overview of hierarchical approaches to Clustering
Should I perform clustering on cleaned data or do some transformations?
Clustering can be performed directly on cleaned data, but also can be performed AFTER a dimention reduction algorithm is performed, like PCA. Majority of the times this usually leads to better reduced , since reducing dimentionality reduce non-importanly features and vairacne thus present a more accurate manifold/hyper-plane of the data.
Does Clustering requres a training pahse like supervised learning?
Since we are not trying to predict/classify our goals now is to organise data into groups thus we dont split our datase but rather trying to optimsie division of data with respect to an optimsiation criteria, we choose.
When is clustering performed in a data sciecne pipeline.Permalink
Clustering is usually perofrmed in the exploratory data anlytics stages
Questions to ask when doing Clustering AlgorithmPermalink
Some of the questions we ask priror to starting the clustering algorithm is;
- How do we represent patterns? Do we represent them as sets of points?
- How we we decided our measure of similarity? Remember in KNN algorithm we use distance in norm to measure
- How many cluster to we have? Again similar to KNN we decides the number of neightbour we choose, how do we know this is right?
- How do we assess the performance of our clusters? Given we cluster a gorup, then how do we evaluate this?
- How do we interpret the results?
Measuring Similarity for Clustering
Similar, to KNN our goals is to put points close to each other in a cluster while far apart points in different cluster, but consequently how would we determine 2 cluster if points are close by. In the examples below one ration method woulc be to cluster data points together (right corner), but how would we seperate the the points seperatly even thought they are as close to each other (middle points).
Hierarchical Algorithms
This methods entails building a “hierarchy” of cluster. Generally, “hierarchy” means to order somethings from highest to lower or from lowest to highest. There are two types of
- Agglomerative - lowest to highest; start with a bunch of cluster then move to one cluster using a optimization criteria
- Divisive - highest to lowest; start with 1 cluster then divide into multiple cluster using optimization criteria
Visualising the problem
Lets use an simple example, say we want given a client comes to use with customer information. The client ask’s ‘find customer segments for us to create a targeted a marketing strategy’. Now we are given only two features ‘Age’ of customer and ‘Annual Spending’. So the first step is to visualise the two groups.
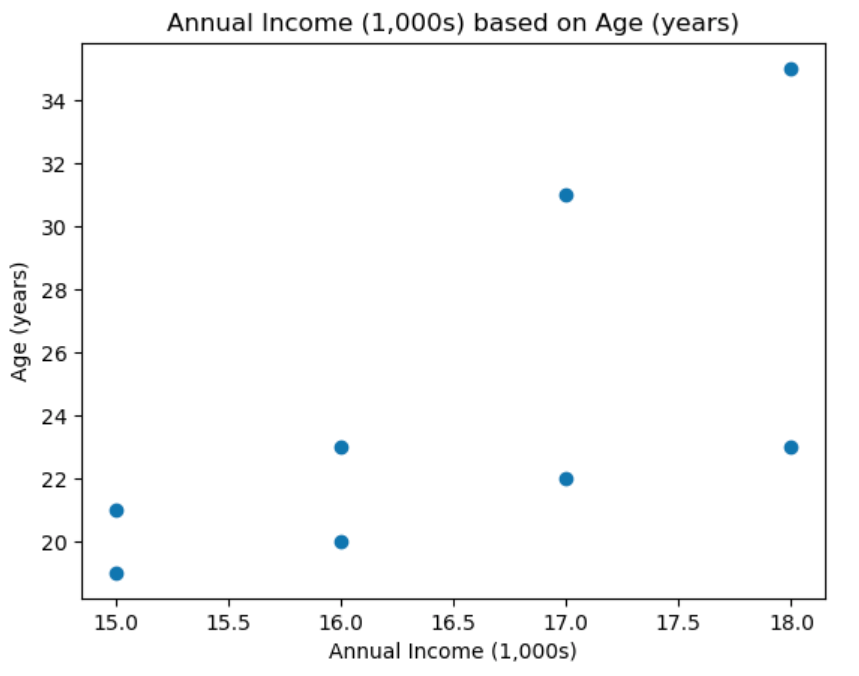
As you can see we only have 8 data-points in this case. Now we that maybe the best approach would be to cluster into maybe 4 clusters,
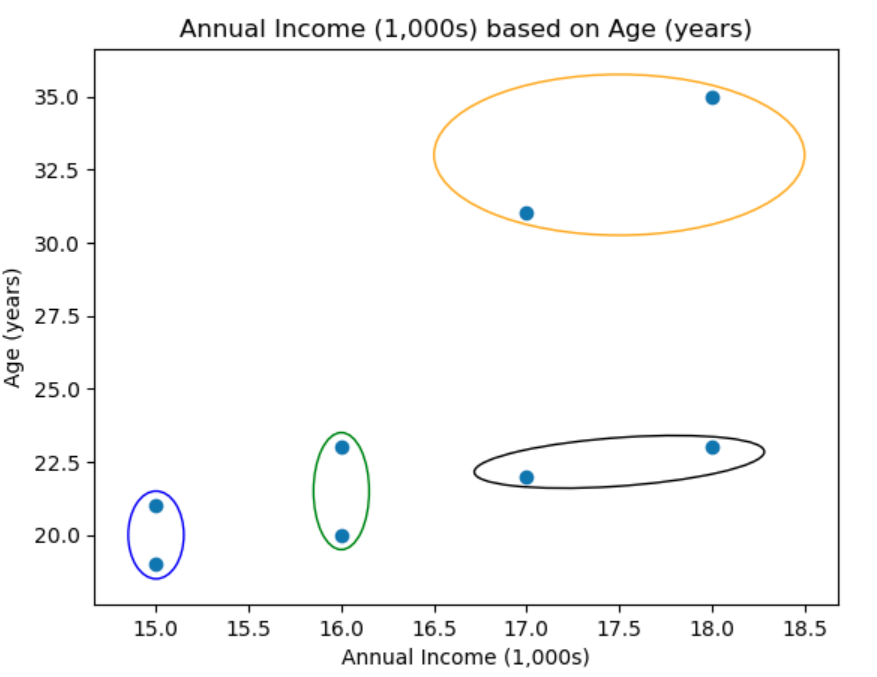
How would a computer do this?
Agglomerative Hierarchical Algorithms
Generally Agglomerative Hierarchical Algorithms are cateogrised in to these cateogries,
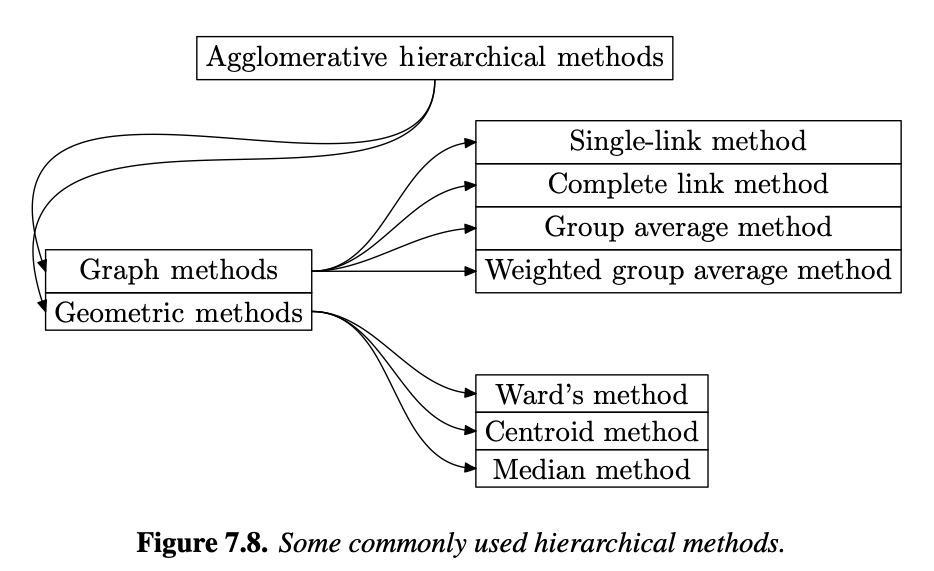
for each graph method (Single/Complete/Grouped-Average) is present different methods of measuring simialirty, which leads to disicions of merging clusters. Which method you chose can chnages they way a cluster is merged.
Graph Methods : Agglomerative Hierarchical Single-Link Method
This is the most used method to perform hierarchical agglomerative clustering, in this case we measure similairty of cluster via min intra-cluster distance, that is, the minimum distance between two clusters, defined as
\[\begin{align*} d(C_i, C_j) = \text{min } d(x_i, x_j) \end{align*}\]where C represent cluster, \(x_i\) points in cluster \(C_i\) and \(x_j\) points in \(C_j\).
So, we start with finding the closest points in to a given to each point and then make each its own cluster, in this case it would be out human intuition,

Although in this case this may be the best number of cluster, in reality this may not be the case. Since all points are in a cluster we next try to find minimum distance to each neighbouring cluster. In this case the purple cluster is clostes to the botton on the green cluster is
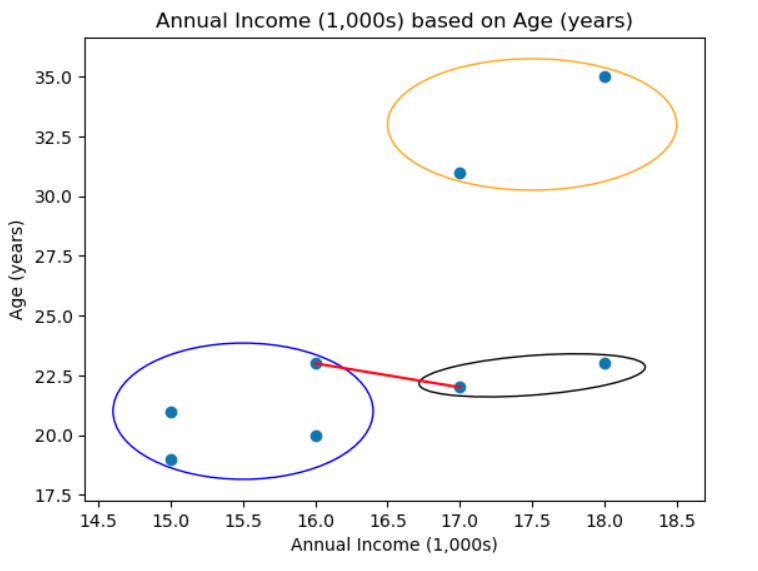
and then join these clusters, so,
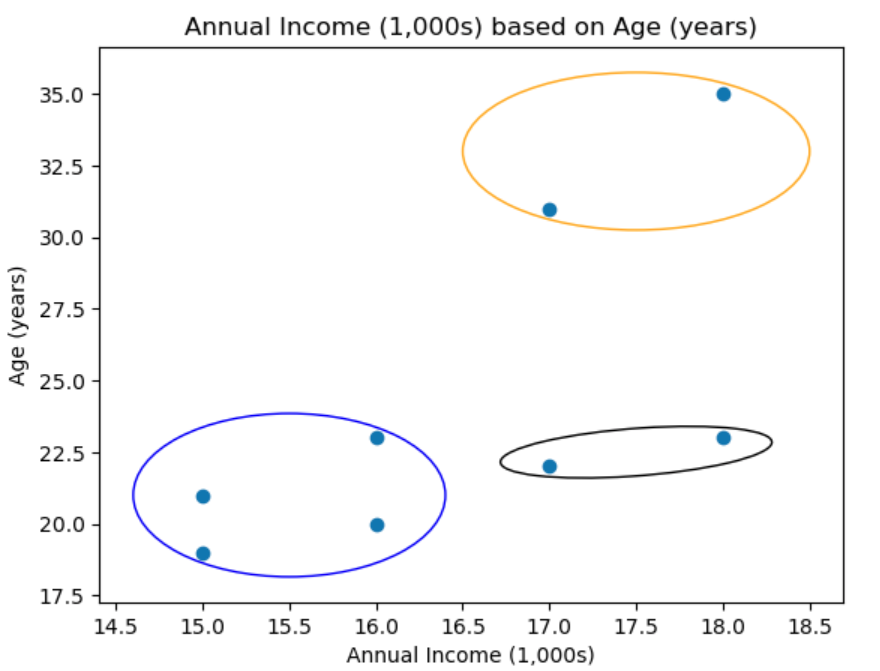
Then we calculate each pnts distance inside the blue cluster to each pnt to other clusters. That is for say a given point in the purple cluster,
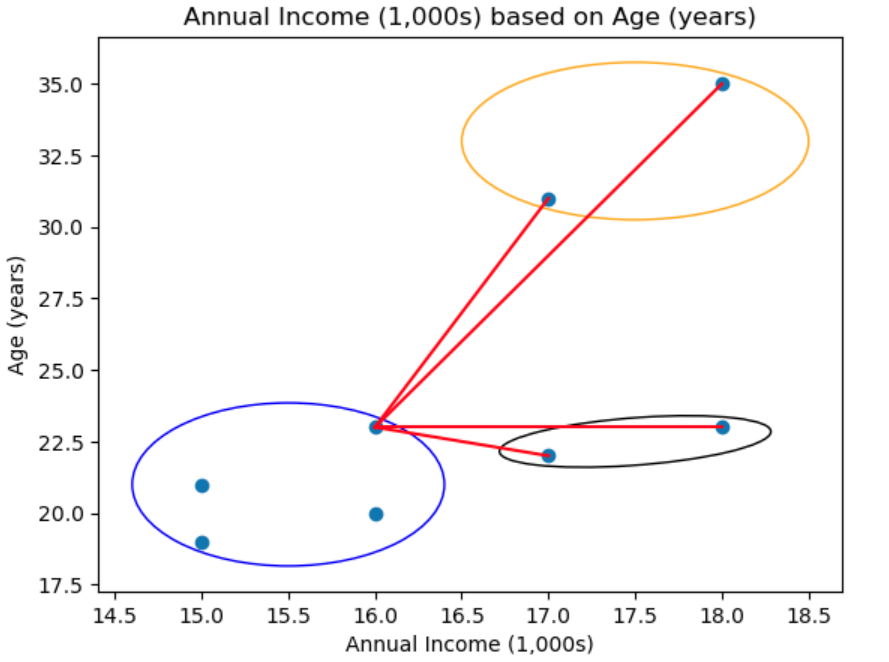
So this is done for all points times this case in the purple cluster and then we find the mimum distance between a datapoint in purple to another cluster that is in this case,

And so we combine these two clusters,
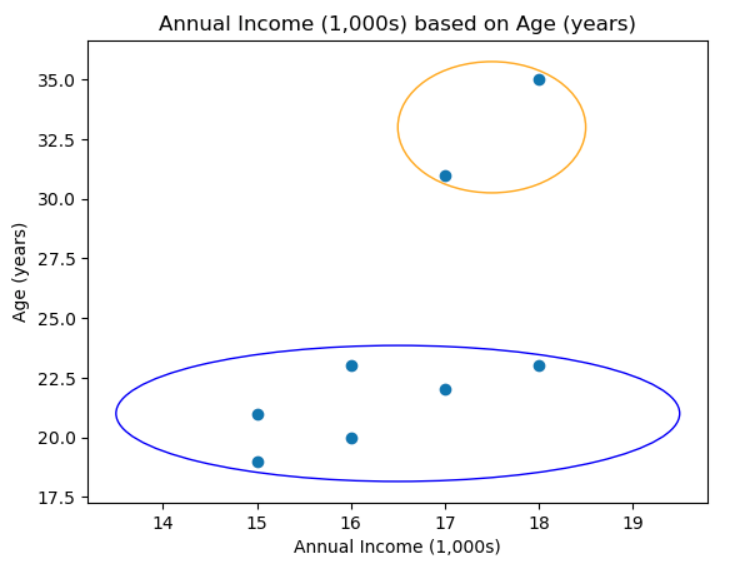
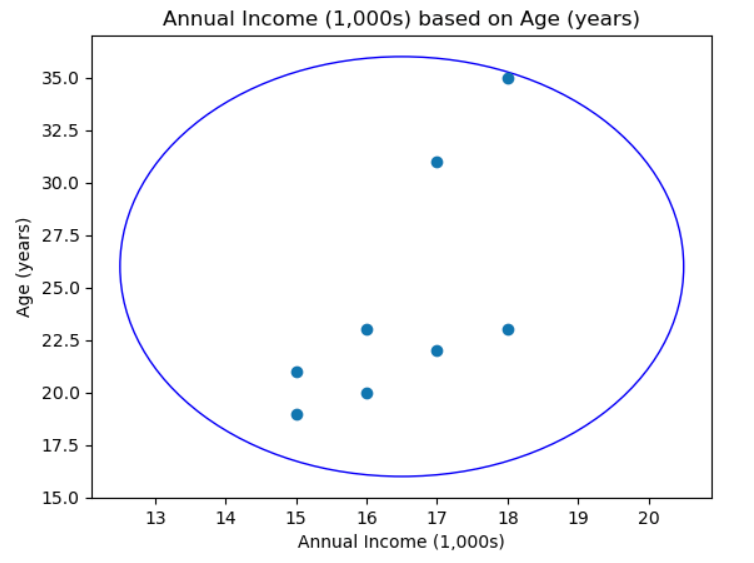
This continues until we finally have one cluster, that is all points are in the same cluster, which is where we initially started!
Graph Methods : Agglomerative Hierarchical Complete-List Method
This takes a the simialr but opposie approach to single-list method, rather then combining cluster based on the minium between two points in between two cluster (intra-distacne), it uses the fursther points to form a cluster, defined by
\[\begin{align*} d(C_i, C_j) = \text{max} d(p, p^') \end{align*}\]Visually this looks like
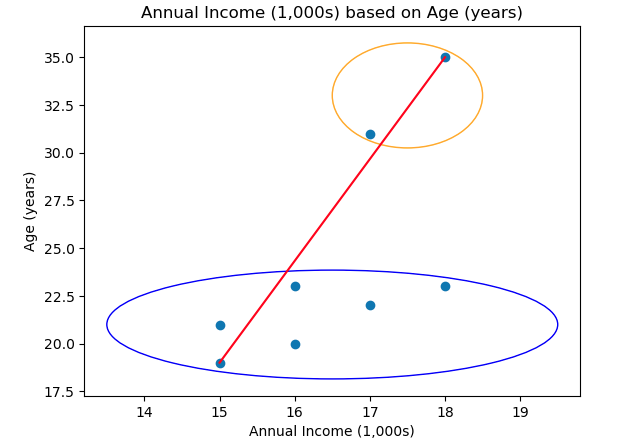
Geoemtric Agglomerative Hierarchical Methods
From the geometric part of Agglomerative Hierarchical Methods, each method is extremely intuitive. For Agglomerative Hierarchical Clustering Centriod Methods, we find the centriod (centre) of the cluster and then we measure simularity simialr to single-method based on \(min d(c_i, c_j)\) so we find the clostest two centriod and merge them together. This continue untill all data points are in one cluster!
How to effectivley visualise this our different options for clusters?
In most cases we dealing with multidimentional features space, so visualising it impossible unless we do some dimension reductionality technique like PCA etc. So the most effective way to visualise thses different potential cluster is through tree-diagrams, althought there are other methods including banner, point representation, etc. There are two main types of tree diagrams used in clustering representation dendrograms and n-tree.
Dendrograms
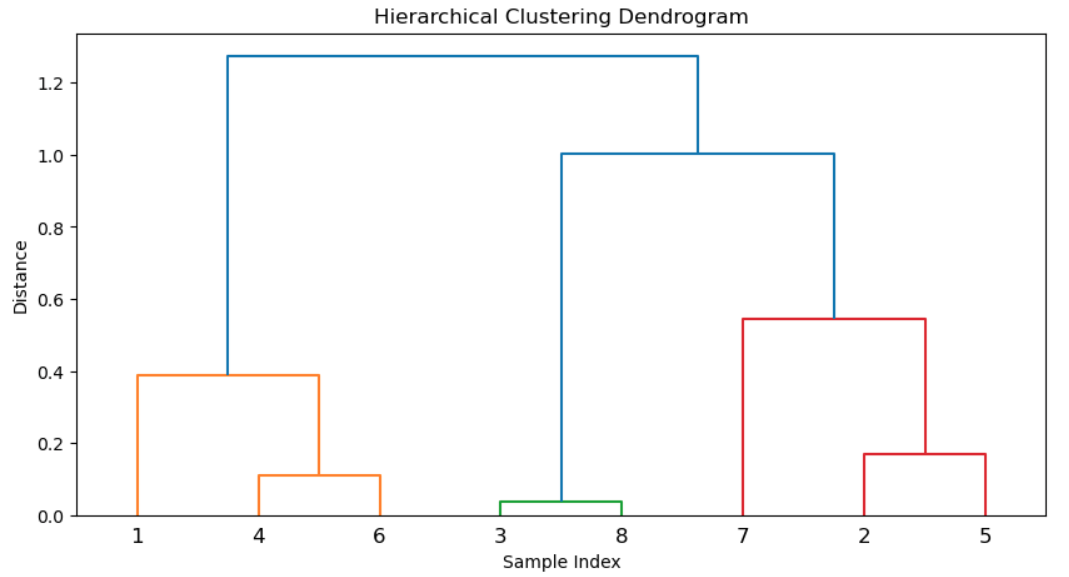
So in the for a agglomerative hierarchical algorithms we start at the bottom and compute, even thought we compute the distance between each point and all other points, we only graph the closest point in the dendrograms. In this case, point 3 was clostes to point 8 with distance of 0.07, while for point 4 closest point was point 6.
Importantly, for point 1 the clostes point was point 4 (not shown in graph), so bacuase of this it form 1 big cluster with point 1, 4, 6 rather then point 4 only since point 4 clostes point isn’t 1 but 6.
n-tree
Below, internal nodes are clusters (A,B,C) whilst the terminal notes/leaves are the data points.
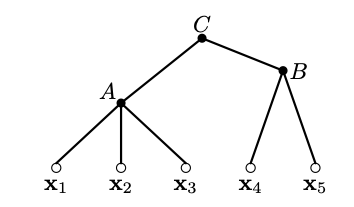
Importantly a dendrograms is a type of n-tree, which all internal notes satisify,
\[\begin{align*} h(A) \leq h(C) \Longleftrightarrow A \subseteq C \end{align*}\]where h: height on n-tree. And A and C a clusters. Intutivley, clearly on our 5-tree diagram h(A) less then h(C) this makes sense we reber back to the n-tree diagram clearly if were were to draw clusters then C takes all points to , but Cluster A only contains to a subset of elements and C. So
Divisive Hierarchical Clustering
In this instance we want to do the opposite of of agglomerative clustering where we start we one large cluster and then break into the smallest cluster (ak.k a cluster containing only two points). There are two main types of Divisive Hierarchical Clustering;
- monothetic - we use one feature as a basis of cluster division
- polythetic - take all features as basis of cluster division
Lets show an example of single-link Divisive Hierarchical Clustering, where we measure simialirty by minium distance. In this case we sperate points which are further away since they show the highest dismilarity in this method. So given,
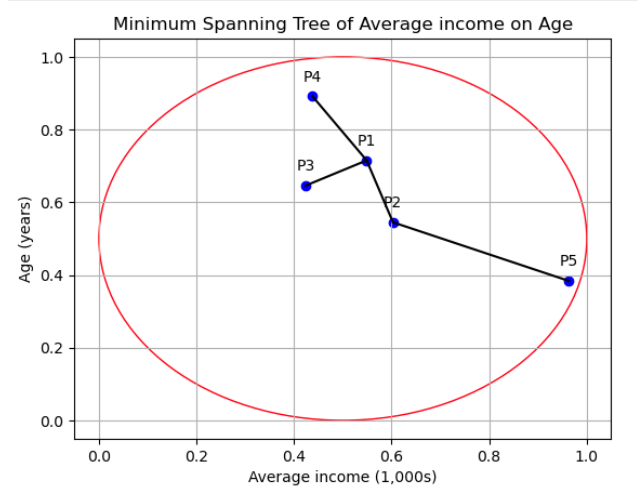
the lies show the Minimum Spanning tree. Clearly, the point with the shortest distance to all other points is P2 to P5, therefore we break that ed and create two clusters as so,
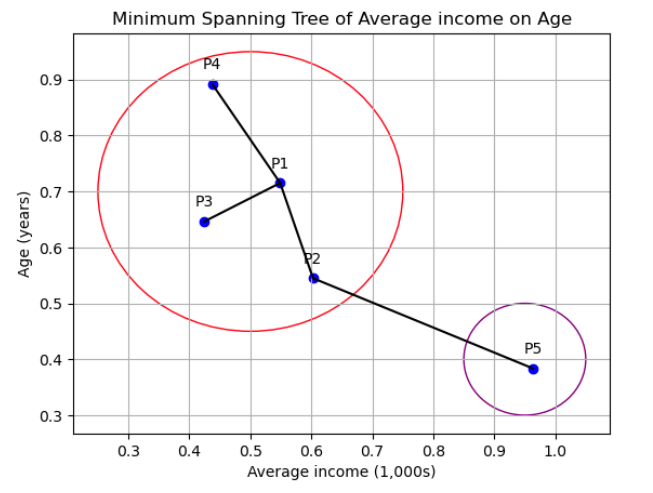
This continue until each point has it own cluster. Now importantly we can also use single-methods complete method, mean-method or any methods, but this chnages our similarity metric
Conclusion
And there we have it! I hope you have gained some intuition about Heiarchial Clustering !
