Evaluating You’re Clustering Model
This is a continuation of my previous blog post about “Hierarchial Clustering Algorithms”. In this blog i hope to teach you teach you a bit about how to evaluate you’re clustering algorithm.
Generally clustering is a form of unsupervised learning that is we dont have any labels, thus evaluvating a clustering algoirthm can be a diffult job. Although, clustering can be used to classify samples which form a semi-supervised learning. Alternativly, if the training data uses the labels as a method of optimisation then clustering can be in the form of supervised learning
Types
Evaluation metric fall under two main catagories :
- Internal - when no label for evaluation (unsupervised) we use the density of cluster, and ingerent properiteis of data to evluate the clusters
- External - givne we have a label for the clusters we can evalute each samples using this label, importantly we didnt use these labels in the traning phase
External
These clustering eveluation method rely on being able to have labels. How this is evaluted is done throuhg using Indicator functions. Let $U = {U_1, U_2,…,U_R}$ be the set of labels classes and $V={V_1, V_2,…,V_K}$ the set of cluster then,
\[\begin{align*} \mathbf{1}_{U}(i,j) = \begin{cases} 1 & \text{if } x_i \in U_r \text{ and } x_j \in U_r , \quad 1 \leq r \leq R\\ 0 & \text{if } \text{otherwise} \\ \end{cases} \\ \mathbf{1}_{V}(i,j) = \begin{cases} 1 & \text{if } x_i \in U_s \text{ and } x_s \in U_r ,\quad 1 \leq s \leq K\\ 0 & \text{if } \text{otherwise} \\ \end{cases} \end{align*}\]External Method 1 : Confusion Matrix
which leads to the contingency table,
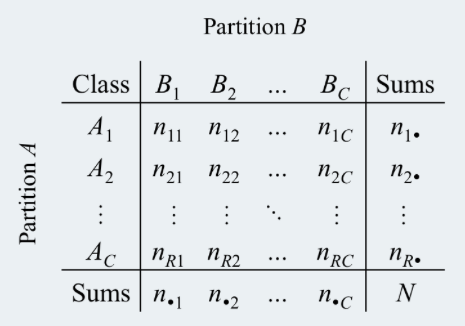
Now each $n_{i,j}$ represents the number of times it is present. So say our class label is {Male, Female}, and from our clustering algorithm it classifies in 3 clusters ${V_1, V_2, V_3}$, then our contingency table would look like this
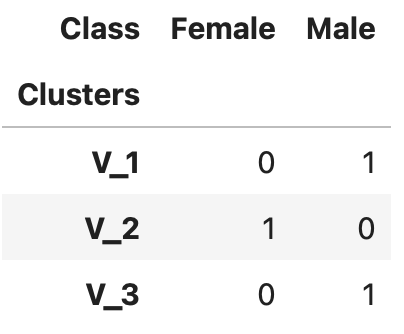
Using this information in the contingency table we can create a confusion matrix,
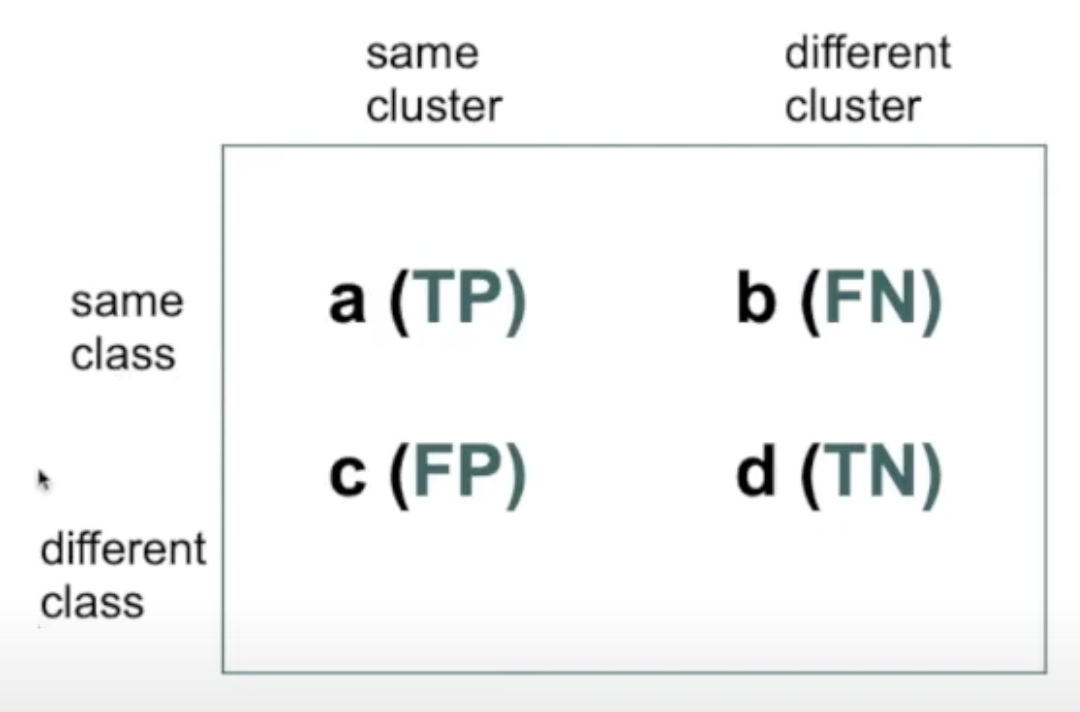
where,
\[\begin{align*} TP = \text{True positive} &= \text{model correctly predicts the positive class} \\ FP = \text{False positive} &= \text{model incorrectly predicts the positive class} \\ TN = \text{true negative} &= \text{model correctly predicts the negative class} \\ FN = \text{false negative} &= \text{model incorrectly predicts the negative class} \end{align*}\]How does this relate to our example? Given we have only two classes then for (class) Males are our positive class and (class) Female are our negative class. Then for the Males (positive) suppose V_1 cluster the correct class for males and females are the negative class given by V_2,
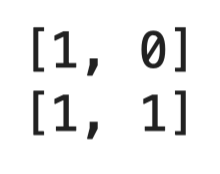
\[\begin{align*} TP &= \text{model correctly predicts the positive class} = 1 \\ FP &= \text{model incorrectly predicts the positive class} = 1 \\ TN &= \text{model correctly predicts the negative class} = 1\\ FN &= \text{model incorrectly predicts the negative class} = 0\\ \end{align*} \\\]Thus, our confusion matrix is,
External Method 2: standard measures (F-score, Recall, precision )
Now to use standard measures we need to modify what standard measures met w.r.t clusters, generally precision, accuracy and F-score are defined as,
\[\begin{align*} precision = \frac{TP}{TP + FP} \\ recall = \frac{TP}{TP + FN} \\ accuracy = \frac{TP + TN}{TP + TN + FN + FP} \\ F1\text{-score} = \frac{2}{\frac{1}{precision} + \frac{1}{recall}} \\ \end{align*}\]Given from all labels (males) how many did it correctly classify and recall is given Males labels in our algorithm did our algorithm get correct? Now interms of clustering;
- precision: From our positive label what percentage did the algorithm correctly classify
- recall: From our cluster how many what percentage of labels inside that cluster are correctly classified (positive)
- accuracy : how of all cluster how many labels did the cluster get right all together
- F1-score: Overall score performance of precision and accuracy
External Method 3: Entropy in Clustering perspective
Entropy enables the abiilty to quantiy simialrities and dfifferences thoruhg probaiblity through measuring expected suprise. Generally entropy is measured as
\(\begin{align*} Entrophy &= \mathbb{E}(Surprise) \Longleftrightarrow\\ &= \sum{x P(X = x)} \Longleftrightarrow \\ &= \sum{log(\frac{1}{P(X = x)}) P(X = x)} \Longleftrightarrow\\ &= \sum{log(\frac{1}{p(x)}) p(x)} \Longleftrightarrow \\ &= \sum{p(x)(log(1) - log(p(x)))} \Longleftrightarrow \\ &= - \sum{p_i(x)log(p_i(x))} \end{align*}\) Now this is the entropy of a cluster i, and then the total entrophy is
\[\begin{align*} Total\text{ }Entrophy &= \text{Sum of all Entropy Clusters}\Longleftrightarrow \\ e &= \sum_{i = 1}^k \frac{n_i}{n} e_i \\ \end{align*}\]Internal Measures
Given we create a cluster without any labels, evaluating a cluster algorithm is extremely difficult. There are two main types,
- Cluster Cohesion - Measure compactness/tightness. How closely related are patterns in the same cluster?
- Cluster separation - Measures isolation. How well separated are the clusters?
Internal Measures 1 : Cluster Cohesion
Cluster Cohesion is a measure of spread out each cluster is, that is whats the dimension of a cluster’s
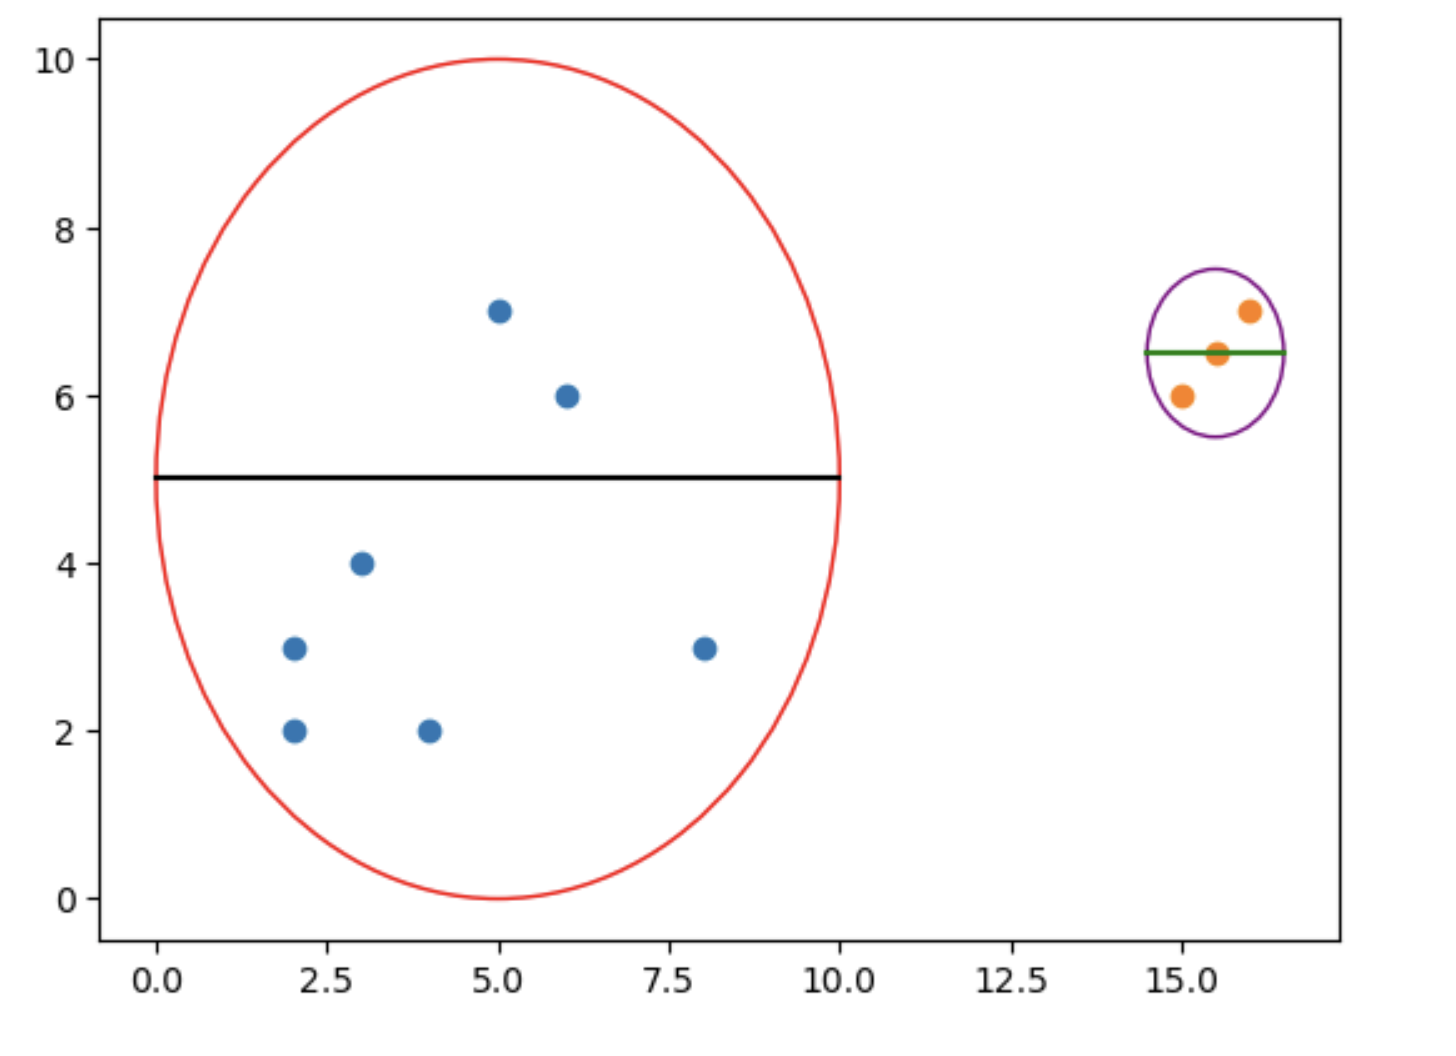
Clearly, the width of left side cluster is larger then the right hand cluster, so left side cluster has lower cohesion score then right side cluster. Mathematicaly, \(\begin{align*} cohesion(C_i) = \sum_{x \in C_i , y \in C_i} proximity(x,y) \\ \end{align*}\) proximity is any measure metric include Euclidean, Mahanttan, or L_p norm. Thus the smaller the proximity the samller then distance between each point within a cluster, thus the smaller the cohesion, and hence the better the result.
Internal Measures 2 : Cluster separation
Cluster seperation measure inter-measure metric, which measure the distance between cluster, that is the futher away the cluster the higher the isolation, thus the hopefully better the cluster generalises.
How to measure Cluster separation
Similar, to creating clusters using aggolmetric hierarchical clustering, you can use a range of methods including single-method, complete-method, mean-method, centroid-method, all of which will create different interpretation of cluster separation metric. Mathematically cluster separation is defined as in single-method
\[\begin{align*} d(C_i, C_j) = \text{min } d(x, y) \end{align*}\]where $x_i$ are all elements in cluster $C_i$ and $y_i$ elements of cluster $C_j$.
Conclusion
I hope after reading this, both you and i have gained a more solid understanding of evaluating our clustering!
